Archive Real Estate

October 2012 housing numbers: Good news for Phoenix Homeowners

November 19, 2012, the National Association of Realtors reported a median price increase of 11.1 percent year-over-year and 5.4 month housing supply for the nation.  Twenty nine percent of these transactions were reported to be “all cash” sales, which should add stability to this rising market.

As covered last week in Housing Inventory Drop is ‘Old News’ for Phoenix,  inventory in the Valley of the Sun is very low – with only a three month supply valley-wide.  These factors, along with an already appreciating market, favorable interest rates and a Fed Chairman pushing for less stringent home loans,  set the premise that the Phoenix housing market looks ready to ramp.

Excerpt below from Fed Chairman Ben S. Bernanke on Challenges in  Housing and Mortgage Markets

“The Federal Reserve’s Senior Loan Officer Opinion Survey on Bank Lending Practices indicates that lenders began tightening mortgage credit standards in 2007 and have not significantly eased standards since.”

“Certainly, some tightening of credit standards was an appropriate response to the lax lending conditions that prevailed in the years leading up to the peak in house prices….However, it seems likely at this point that the pendulum has swung too far the other way, and that overly tight lending standards may now be preventing creditworthy borrowers from buying homes, thereby slowing the revival in housing and impeding the economic recovery.”

If banks follow through and ease credit, even more money will be chasing an already tight supply of housing.

Big money confirms positive sentiment, with the purchase of 563 acres in Mesa cited as one recent example.  While there are contingent factors like interest rates, how the approaching Fiscal Cliff and solvency issues of FHA are handled, the Phoenix housing market looks bright from here.

Comments Off

Housing Inventory Drop is “Old News” for Phoenix

Over the past year or so, Phoenix housing saw market improvements reminiscent of 2003 – when the market started rumbling it’s previous parabolic ascent.  Rates are extraordinarily favorable and buyers again are chasing homes as they come on the market.  If they need certainty and must have a house by a specific date, waiting for bank-owned or short sale approval is not an option; so their “real” available inventory is even more limited.  Current residential statistics show only about a 3 month supply of homes across The Valley.

The Monthly Housing Summary released November 14, 2012 by the National Association of Realtors, details year over year changes by geographic area and headlines boast “Report:  Housing Inventory declines 17% year-over-year in October“.   The data presented, shows Phoenix has seen more than a 20% drop in inventory for this same period.

These headline numbers voice the frustration of  cautious buyers in the Phoenix area.  The good news is that despite the reported drop in year-over-year inventory, the number of listings have grown since  May, 2012 and the latest month-over-month inventory grew by almost six percent.

When there is only a three month supply of homes on the market, an increase of  available inventory is healthy for a sustainable market.  More good news is that short term median list prices overshot in April 2012 and have gradually been adjusting to levels that might be appealing to buyers.

Next week we see how the the scheduled NAR report on existing home sales and inventory stacks up with the local market.

Short Sale & Foreclosure Stats

Election day 2012, Calculated Risk posted an updated Table of Short Sales and Foreclosures from Selected Cities from economist Tom Lawler.  Our data confirms positive trends in the Phoenix area.  With nearly 40% of sales categorized as “Distressed” in Phoenix, the market needs momentum to keep clearing distressed properties from inventory.

Comments Off

USA & State Comparison: Year over Year Housing Prices Infographic

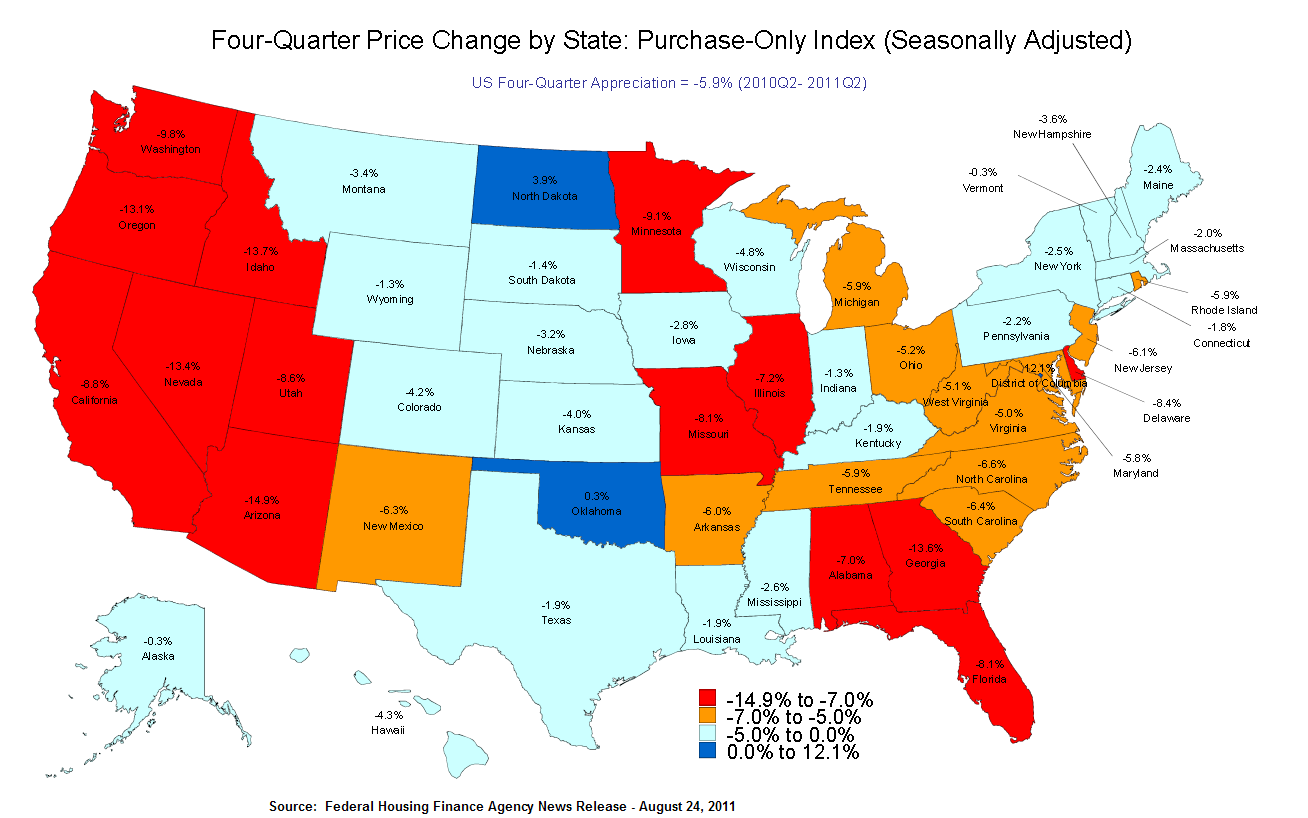
The Federal Housing Finance Agency (FHFA) issued their 83 page News Release August 24, 2011 – which include an expanded data set (see page 13 for highlights on the new expanded data set if you care).  While the original (Purchase-Only) data set does not seem to keep pace with the market – the infographic below (created by FHFA from this data) provides a quick overall and relative perspective.

FHFA State by State Infographic

Click to Expand

Comments Off

Photo

WiseValue

August 25th

History

Investment

Real Estate

Phoenix Metro Housing Market Stats May 2011

A recent press release from DataQuick provides some noteworthy stats on Phoenix Metro home sales.  While the whole piece is worth reading, highlights of the DataQuick Report include:

  • >Total sales (new and resale for condos and houses) increased 4.9% in May year over year.
  • >Homes under $100,000 accounted for 39.7% of all May sales.
  • >May 2011 demand for residential construction fell to 6.8% from 10.1% of all sales year over year — a greater than 30% drop for an already decimated sector.
  • >FHA was used to finance 35.5% of all sales in May — down from 46.4% for May 2010.
  • >Cash buyers increased from 34.4% last May to 42% of all sales for May 2011.
  • >Absentee buyers (which could be an investor or second home buyer) increased year over year for the month of May from 37.8% to 45.3% of all sales.
  • >64% of sales were either sales of foreclosed homes or short sales.
  • >The median price of resale houses fell 13% year over year, while resale condos for the same time period fell 18.4%.

Wisevalue.com conclusion: The increase in total sales and cash buyers are a positive sign for price stabilization.  However, the level of distressed sales and conversion from owner-occupied to rental properties, coupled with the potential wave of foreclosure inventory we covered here; translates into a long and arduous journey to find stable prices and eventually…..someday…..appreciation.

Comments Off

ASU: Phoenix Area Resale Home Market Report for May 2011

The ASU W.P. Carey School of Business – Division of Real Estate recently released the Resale Home Market report for May 2011.  The report addressed  how foreclosure sale activity declined from 43 percent of the market in January 2011 to 35 percent in May 2011.  Median prices and variance in different cities within this massive market were also discussed.   Unfortunately, the report does not seem to convey the full magnitude of the foreclosure storm on the horizon, as it stated:

Although the number of foreclosure prefilings has been declining for the last several months, this trend is not unusual in the early part of the year with a typical pickup over the next few months. While any decline is positive, fundamental uncertainty remains as to whether the downward trend will continue to where foreclosures cease to be the dominate force in the market.

Learn more about looming foreclosures on the horizon from our April post titled, “Where are the foreclosure sales?” and check out the Calculated Risk article and chart below for the Percent of Homeowners with Mortgage Negative Equity by State.

Comments Off

Where are the foreclosure sales?

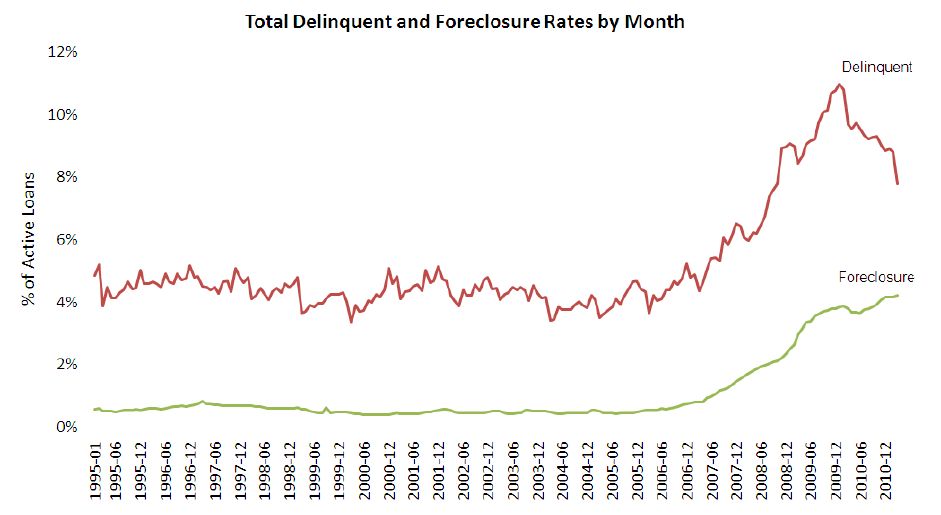
According to the LPS Applied Analytics Mortage Monitor for March 2011; mortgage delinquencies are down from 8.8% in February 2011  to 7.78% for March 2011 – versus 9.66% in March 2010 (still horrible, but better – see Chart below provided by LPS).  They also note March typically sees large seasonal declines.  Even considering the sasonality, it’s good news.

Now for the bad news.  The report shows foreclosure starts occurring at a rate about 2.85 times faster than foreclosure sales…so the shadow inventory builds.   In addition, 31% of the loans in foreclosure have not made a payment in over 2 years. If that sounds like a big number, get this:  67% have not made a payment for at least one year or more!

Comments Off

Photo

WiseValue

April 29th

Foreclosure

Mortgage

Real Estate

Existing vs. New Home Sales = Opportunity?

April 25, 2011 – Calculated Risk charts and comments on divergent sales rates for new and existing homes.  This raises important questions that must be answered:

1.  Will the sales rate of existing homes decline or  the sales rate of new homes rise to close this historical gap?

2.  Which major component of the new home do you think will most dramatically adjust (or has already adjusted in some areas) to help bring new home prices in line with resale home prices?

3.  Is a buying opportunity presented for long term investment in this major price-adjusted component?

If you choose to make an investment in this asset; remember it is illiquid  and will likely take many years to determine if your thesis is correct.   Tread carefully and choose well.

Comments Off

Photo

WiseValue

April 26th

Investment

Projections

Real Estate

Perspective: New Home Sales

January 26, 2011 CNNMoney Headline:  “New home sales jump to 8-month high“.  Sound like great news -  right?  To put this in perspective, be sure to see the easy-to-read detailed analysis and charts in “New Home Sales increase in December” posted at Calculated Risk.  Good stuff.

Comments Off

Photo

WiseValue

January 26th

History

Real Estate

Phoenix: S&P / Case-Shiller Home Price Indices released 1-25-2011

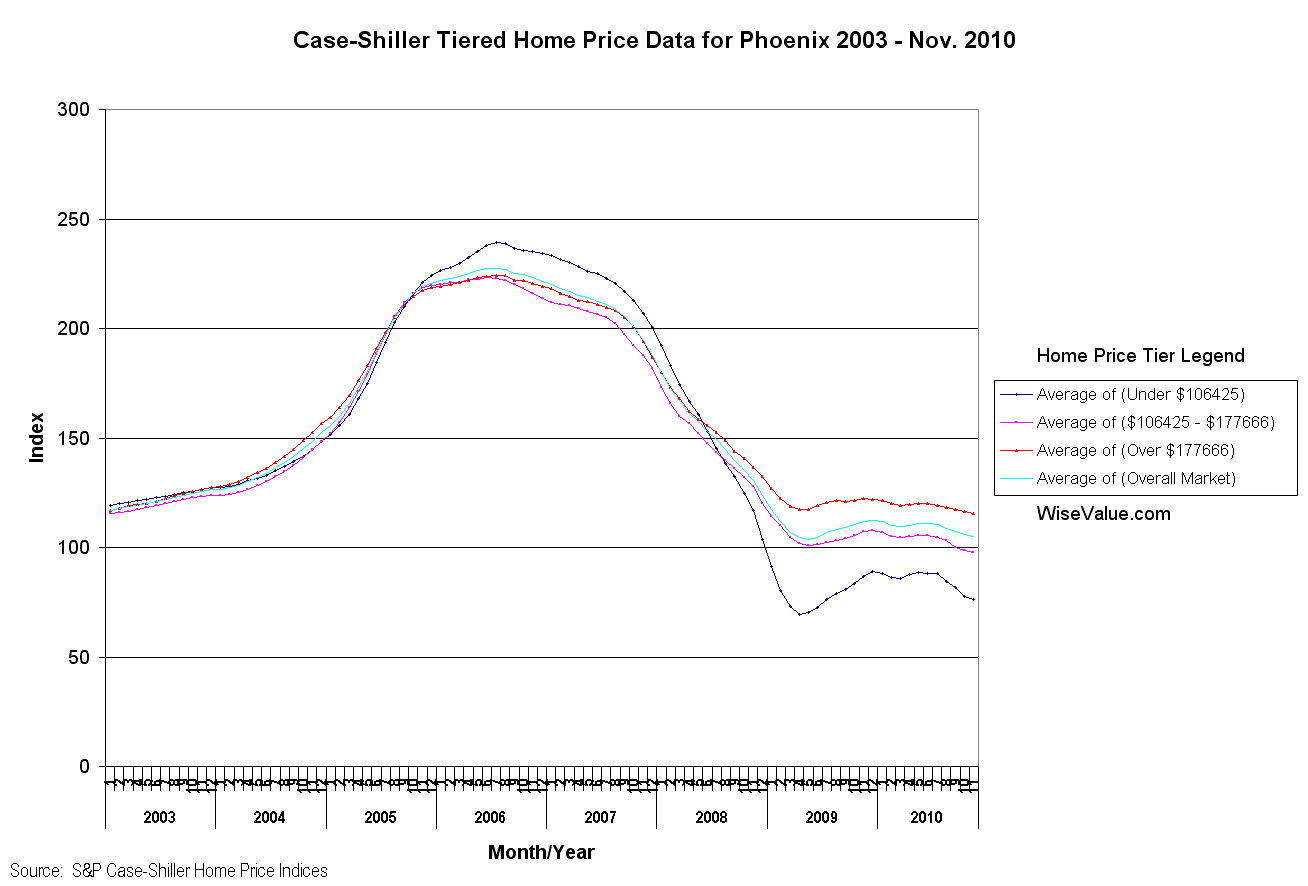
The S&P / Case-Shiller Home Price Index was released today with the three month moving average available through November 2010.  The most recent numbers available for the Phoenix Metropolitan Area have been graphed  based on Case-Shiller price tiers.

If the “typical” family moves every five to seven years, it’s clear there is more pain on the horizon for sellers and potential opportunity for new buyers.

Comments Off

Photo

WiseValue

January 25th

Arizona

History

Phoenix

Projections

Real Estate
line
January 2025
M T W T F S S
« Nov    
 12345
6789101112
13141516171819
20212223242526
2728293031