Archive Mortgage

Housing Inventory Drop is “Old News” for Phoenix

Over the past year or so, Phoenix housing saw market improvements reminiscent of 2003 – when the market started rumbling it’s previous parabolic ascent.  Rates are extraordinarily favorable and buyers again are chasing homes as they come on the market.  If they need certainty and must have a house by a specific date, waiting for bank-owned or short sale approval is not an option; so their “real” available inventory is even more limited.  Current residential statistics show only about a 3 month supply of homes across The Valley.

The Monthly Housing Summary released November 14, 2012 by the National Association of Realtors, details year over year changes by geographic area and headlines boast “Report:  Housing Inventory declines 17% year-over-year in October“.   The data presented, shows Phoenix has seen more than a 20% drop in inventory for this same period.

These headline numbers voice the frustration of  cautious buyers in the Phoenix area.  The good news is that despite the reported drop in year-over-year inventory, the number of listings have grown since  May, 2012 and the latest month-over-month inventory grew by almost six percent.

When there is only a three month supply of homes on the market, an increase of  available inventory is healthy for a sustainable market.  More good news is that short term median list prices overshot in April 2012 and have gradually been adjusting to levels that might be appealing to buyers.

Next week we see how the the scheduled NAR report on existing home sales and inventory stacks up with the local market.

ASU: Phoenix Area Resale Home Market Report for May 2011

The ASU W.P. Carey School of Business – Division of Real Estate recently released the Resale Home Market report for May 2011.  The report addressed  how foreclosure sale activity declined from 43 percent of the market in January 2011 to 35 percent in May 2011.  Median prices and variance in different cities within this massive market were also discussed.   Unfortunately, the report does not seem to convey the full magnitude of the foreclosure storm on the horizon, as it stated:

Although the number of foreclosure prefilings has been declining for the last several months, this trend is not unusual in the early part of the year with a typical pickup over the next few months. While any decline is positive, fundamental uncertainty remains as to whether the downward trend will continue to where foreclosures cease to be the dominate force in the market.

Learn more about looming foreclosures on the horizon from our April post titled, “Where are the foreclosure sales?” and check out the Calculated Risk article and chart below for the Percent of Homeowners with Mortgage Negative Equity by State.

Comments Off

Where are the foreclosure sales?

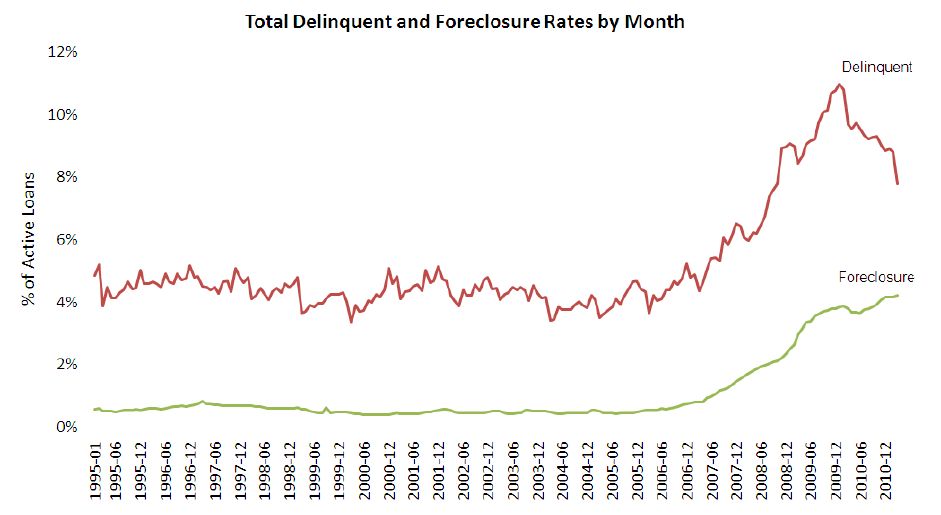
According to the LPS Applied Analytics Mortage Monitor for March 2011; mortgage delinquencies are down from 8.8% in February 2011  to 7.78% for March 2011 – versus 9.66% in March 2010 (still horrible, but better – see Chart below provided by LPS).  They also note March typically sees large seasonal declines.  Even considering the sasonality, it’s good news.

Now for the bad news.  The report shows foreclosure starts occurring at a rate about 2.85 times faster than foreclosure sales…so the shadow inventory builds.   In addition, 31% of the loans in foreclosure have not made a payment in over 2 years. If that sounds like a big number, get this:  67% have not made a payment for at least one year or more!

Comments Off

Photo

WiseValue

April 29th

Foreclosure

Mortgage

Real Estate
line
January 2025
M T W T F S S
« Nov    
 12345
6789101112
13141516171819
20212223242526
2728293031