Archive History

USA & State Comparison: Year over Year Housing Prices Infographic

The Federal Housing Finance Agency (FHFA) issued their 83 page News Release August 24, 2011 – which include an expanded data set (see page 13 for highlights on the new expanded data set if you care).  While the original (Purchase-Only) data set does not seem to keep pace with the market – the infographic below (created by FHFA from this data) provides a quick overall and relative perspective.

FHFA State by State Infographic

Click to Expand

Comments Off

Photo

WiseValue

August 25th

History

Investment

Real Estate

Phoenix Metro Housing Market Stats May 2011

A recent press release from DataQuick provides some noteworthy stats on Phoenix Metro home sales.  While the whole piece is worth reading, highlights of the DataQuick Report include:

  • >Total sales (new and resale for condos and houses) increased 4.9% in May year over year.
  • >Homes under $100,000 accounted for 39.7% of all May sales.
  • >May 2011 demand for residential construction fell to 6.8% from 10.1% of all sales year over year — a greater than 30% drop for an already decimated sector.
  • >FHA was used to finance 35.5% of all sales in May — down from 46.4% for May 2010.
  • >Cash buyers increased from 34.4% last May to 42% of all sales for May 2011.
  • >Absentee buyers (which could be an investor or second home buyer) increased year over year for the month of May from 37.8% to 45.3% of all sales.
  • >64% of sales were either sales of foreclosed homes or short sales.
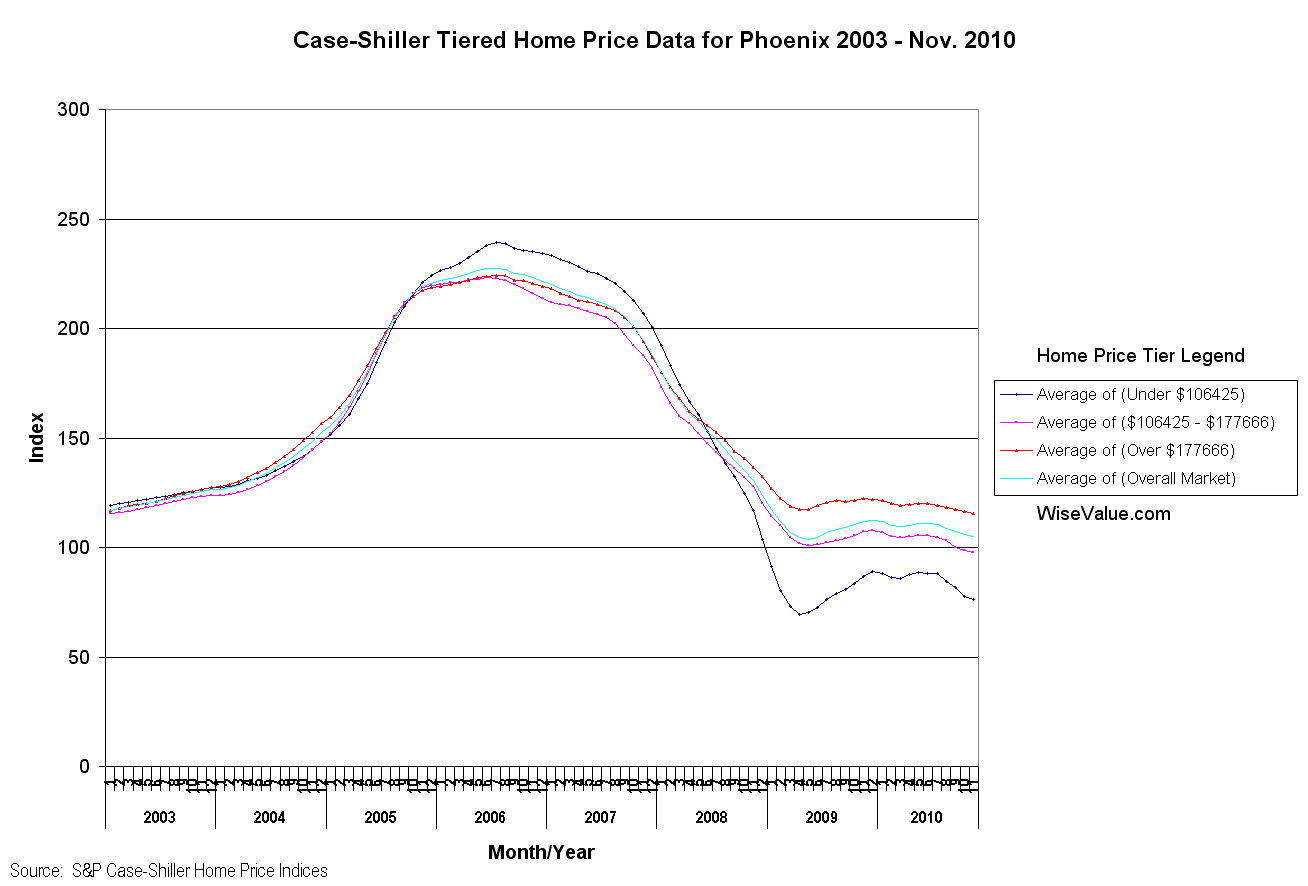
  • >The median price of resale houses fell 13% year over year, while resale condos for the same time period fell 18.4%.

Wisevalue.com conclusion: The increase in total sales and cash buyers are a positive sign for price stabilization.  However, the level of distressed sales and conversion from owner-occupied to rental properties, coupled with the potential wave of foreclosure inventory we covered here; translates into a long and arduous journey to find stable prices and eventually…..someday…..appreciation.

Comments Off

Perspective: New Home Sales

January 26, 2011 CNNMoney Headline:  “New home sales jump to 8-month high“.  Sound like great news -  right?  To put this in perspective, be sure to see the easy-to-read detailed analysis and charts in “New Home Sales increase in December” posted at Calculated Risk.  Good stuff.

Comments Off

Photo

WiseValue

January 26th

History

Real Estate

Phoenix: S&P / Case-Shiller Home Price Indices released 1-25-2011

The S&P / Case-Shiller Home Price Index was released today with the three month moving average available through November 2010.  The most recent numbers available for the Phoenix Metropolitan Area have been graphed  based on Case-Shiller price tiers.

If the “typical” family moves every five to seven years, it’s clear there is more pain on the horizon for sellers and potential opportunity for new buyers.

Comments Off

Photo

WiseValue

January 25th

Arizona

History

Phoenix

Projections

Real Estate

IS HOUSING DUE TO REVERT TO THE MEAN PRICE?

While there are many factors that can affect real estate prices, some believe we still have more downside.  In the following article, Cullen Roche provides rational reasoning for this perspective.

http://pragcap.com/is-housing-due-to-revert-to-the-mean-price

Comments Off

Photo

WiseValue

January 3rd

History

Projections

Real Estate
line
September 2024
M T W T F S S
« Nov    
 1
2345678
9101112131415
16171819202122
23242526272829
30