Archive Foreclosure

Short Sale & Foreclosure Stats

Election day 2012, Calculated Risk posted an updated Table of Short Sales and Foreclosures from Selected Cities from economist Tom Lawler.  Our data confirms positive trends in the Phoenix area.  With nearly 40% of sales categorized as “Distressed” in Phoenix, the market needs momentum to keep clearing distressed properties from inventory.

Comments Off

Phoenix Metro Housing Market Stats May 2011

A recent press release from DataQuick provides some noteworthy stats on Phoenix Metro home sales.  While the whole piece is worth reading, highlights of the DataQuick Report include:

  • >Total sales (new and resale for condos and houses) increased 4.9% in May year over year.
  • >Homes under $100,000 accounted for 39.7% of all May sales.
  • >May 2011 demand for residential construction fell to 6.8% from 10.1% of all sales year over year — a greater than 30% drop for an already decimated sector.
  • >FHA was used to finance 35.5% of all sales in May — down from 46.4% for May 2010.
  • >Cash buyers increased from 34.4% last May to 42% of all sales for May 2011.
  • >Absentee buyers (which could be an investor or second home buyer) increased year over year for the month of May from 37.8% to 45.3% of all sales.
  • >64% of sales were either sales of foreclosed homes or short sales.
  • >The median price of resale houses fell 13% year over year, while resale condos for the same time period fell 18.4%.

Wisevalue.com conclusion: The increase in total sales and cash buyers are a positive sign for price stabilization.  However, the level of distressed sales and conversion from owner-occupied to rental properties, coupled with the potential wave of foreclosure inventory we covered here; translates into a long and arduous journey to find stable prices and eventually…..someday…..appreciation.

Comments Off

ASU: Phoenix Area Resale Home Market Report for May 2011

The ASU W.P. Carey School of Business – Division of Real Estate recently released the Resale Home Market report for May 2011.  The report addressed  how foreclosure sale activity declined from 43 percent of the market in January 2011 to 35 percent in May 2011.  Median prices and variance in different cities within this massive market were also discussed.   Unfortunately, the report does not seem to convey the full magnitude of the foreclosure storm on the horizon, as it stated:

Although the number of foreclosure prefilings has been declining for the last several months, this trend is not unusual in the early part of the year with a typical pickup over the next few months. While any decline is positive, fundamental uncertainty remains as to whether the downward trend will continue to where foreclosures cease to be the dominate force in the market.

Learn more about looming foreclosures on the horizon from our April post titled, “Where are the foreclosure sales?” and check out the Calculated Risk article and chart below for the Percent of Homeowners with Mortgage Negative Equity by State.

Comments Off

Where are the foreclosure sales?

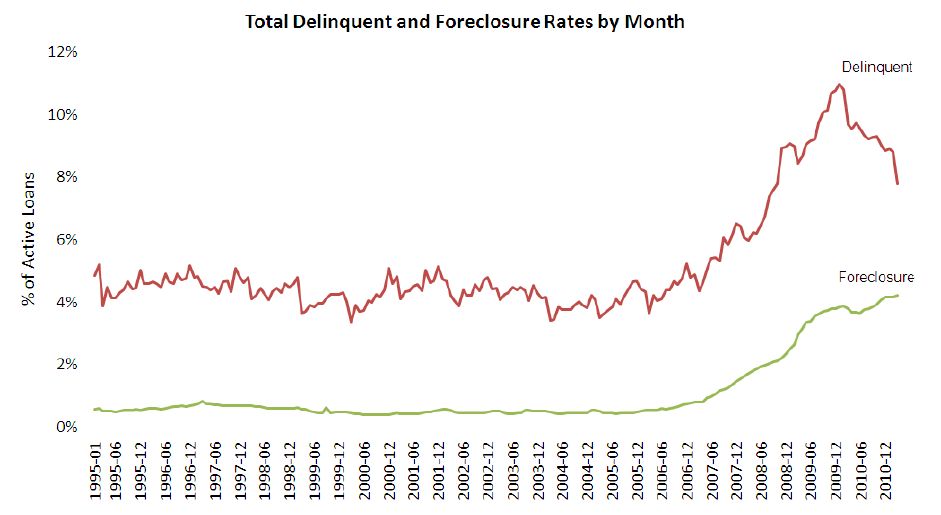
According to the LPS Applied Analytics Mortage Monitor for March 2011; mortgage delinquencies are down from 8.8% in February 2011  to 7.78% for March 2011 – versus 9.66% in March 2010 (still horrible, but better – see Chart below provided by LPS).  They also note March typically sees large seasonal declines.  Even considering the sasonality, it’s good news.

Now for the bad news.  The report shows foreclosure starts occurring at a rate about 2.85 times faster than foreclosure sales…so the shadow inventory builds.   In addition, 31% of the loans in foreclosure have not made a payment in over 2 years. If that sounds like a big number, get this:  67% have not made a payment for at least one year or more!

Comments Off

Photo

WiseValue

April 29th

Foreclosure

Mortgage

Real Estate
line
September 2024
M T W T F S S
« Nov    
 1
2345678
9101112131415
16171819202122
23242526272829
30