Archive for April, 2011

Where are the foreclosure sales?

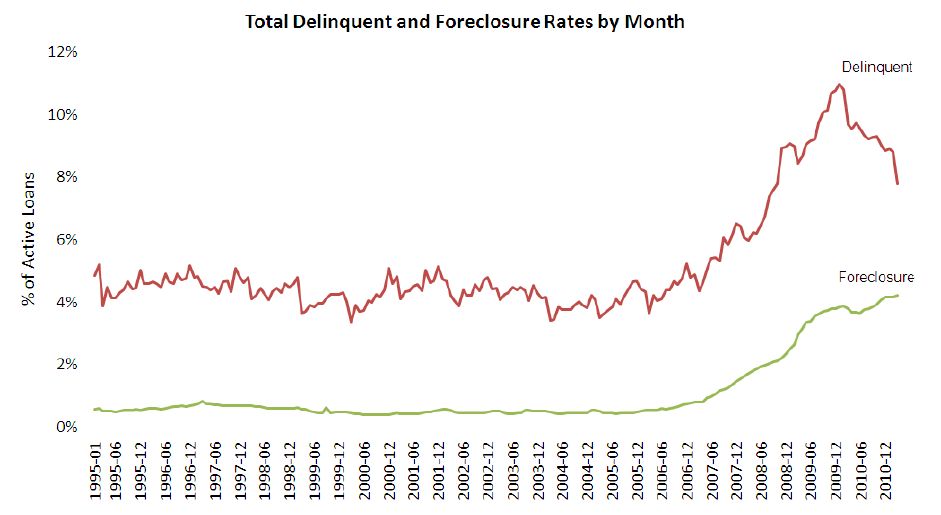
According to the LPS Applied Analytics Mortage Monitor for March 2011; mortgage delinquencies are down from 8.8% in February 2011  to 7.78% for March 2011 – versus 9.66% in March 2010 (still horrible, but better – see Chart below provided by LPS).  They also note March typically sees large seasonal declines.  Even considering the sasonality, it’s good news.

Now for the bad news.  The report shows foreclosure starts occurring at a rate about 2.85 times faster than foreclosure sales…so the shadow inventory builds.   In addition, 31% of the loans in foreclosure have not made a payment in over 2 years. If that sounds like a big number, get this:  67% have not made a payment for at least one year or more!

Comments Off
Photo

WiseValue

April 29th

Foreclosure

Mortgage

Real Estate

Existing vs. New Home Sales = Opportunity?

April 25, 2011 – Calculated Risk charts and comments on divergent sales rates for new and existing homes.  This raises important questions that must be answered:

1.  Will the sales rate of existing homes decline or  the sales rate of new homes rise to close this historical gap?

2.  Which major component of the new home do you think will most dramatically adjust (or has already adjusted in some areas) to help bring new home prices in line with resale home prices?

3.  Is a buying opportunity presented for long term investment in this major price-adjusted component?

If you choose to make an investment in this asset; remember it is illiquid  and will likely take many years to determine if your thesis is correct.   Tread carefully and choose well.

Comments Off

Photo

WiseValue

April 26th

Investment

Projections

Real Estate
line
April 2011
M T W T F S S
« Jan   Jun »
 123
45678910
11121314151617
18192021222324
252627282930